Account A Projection Valuation
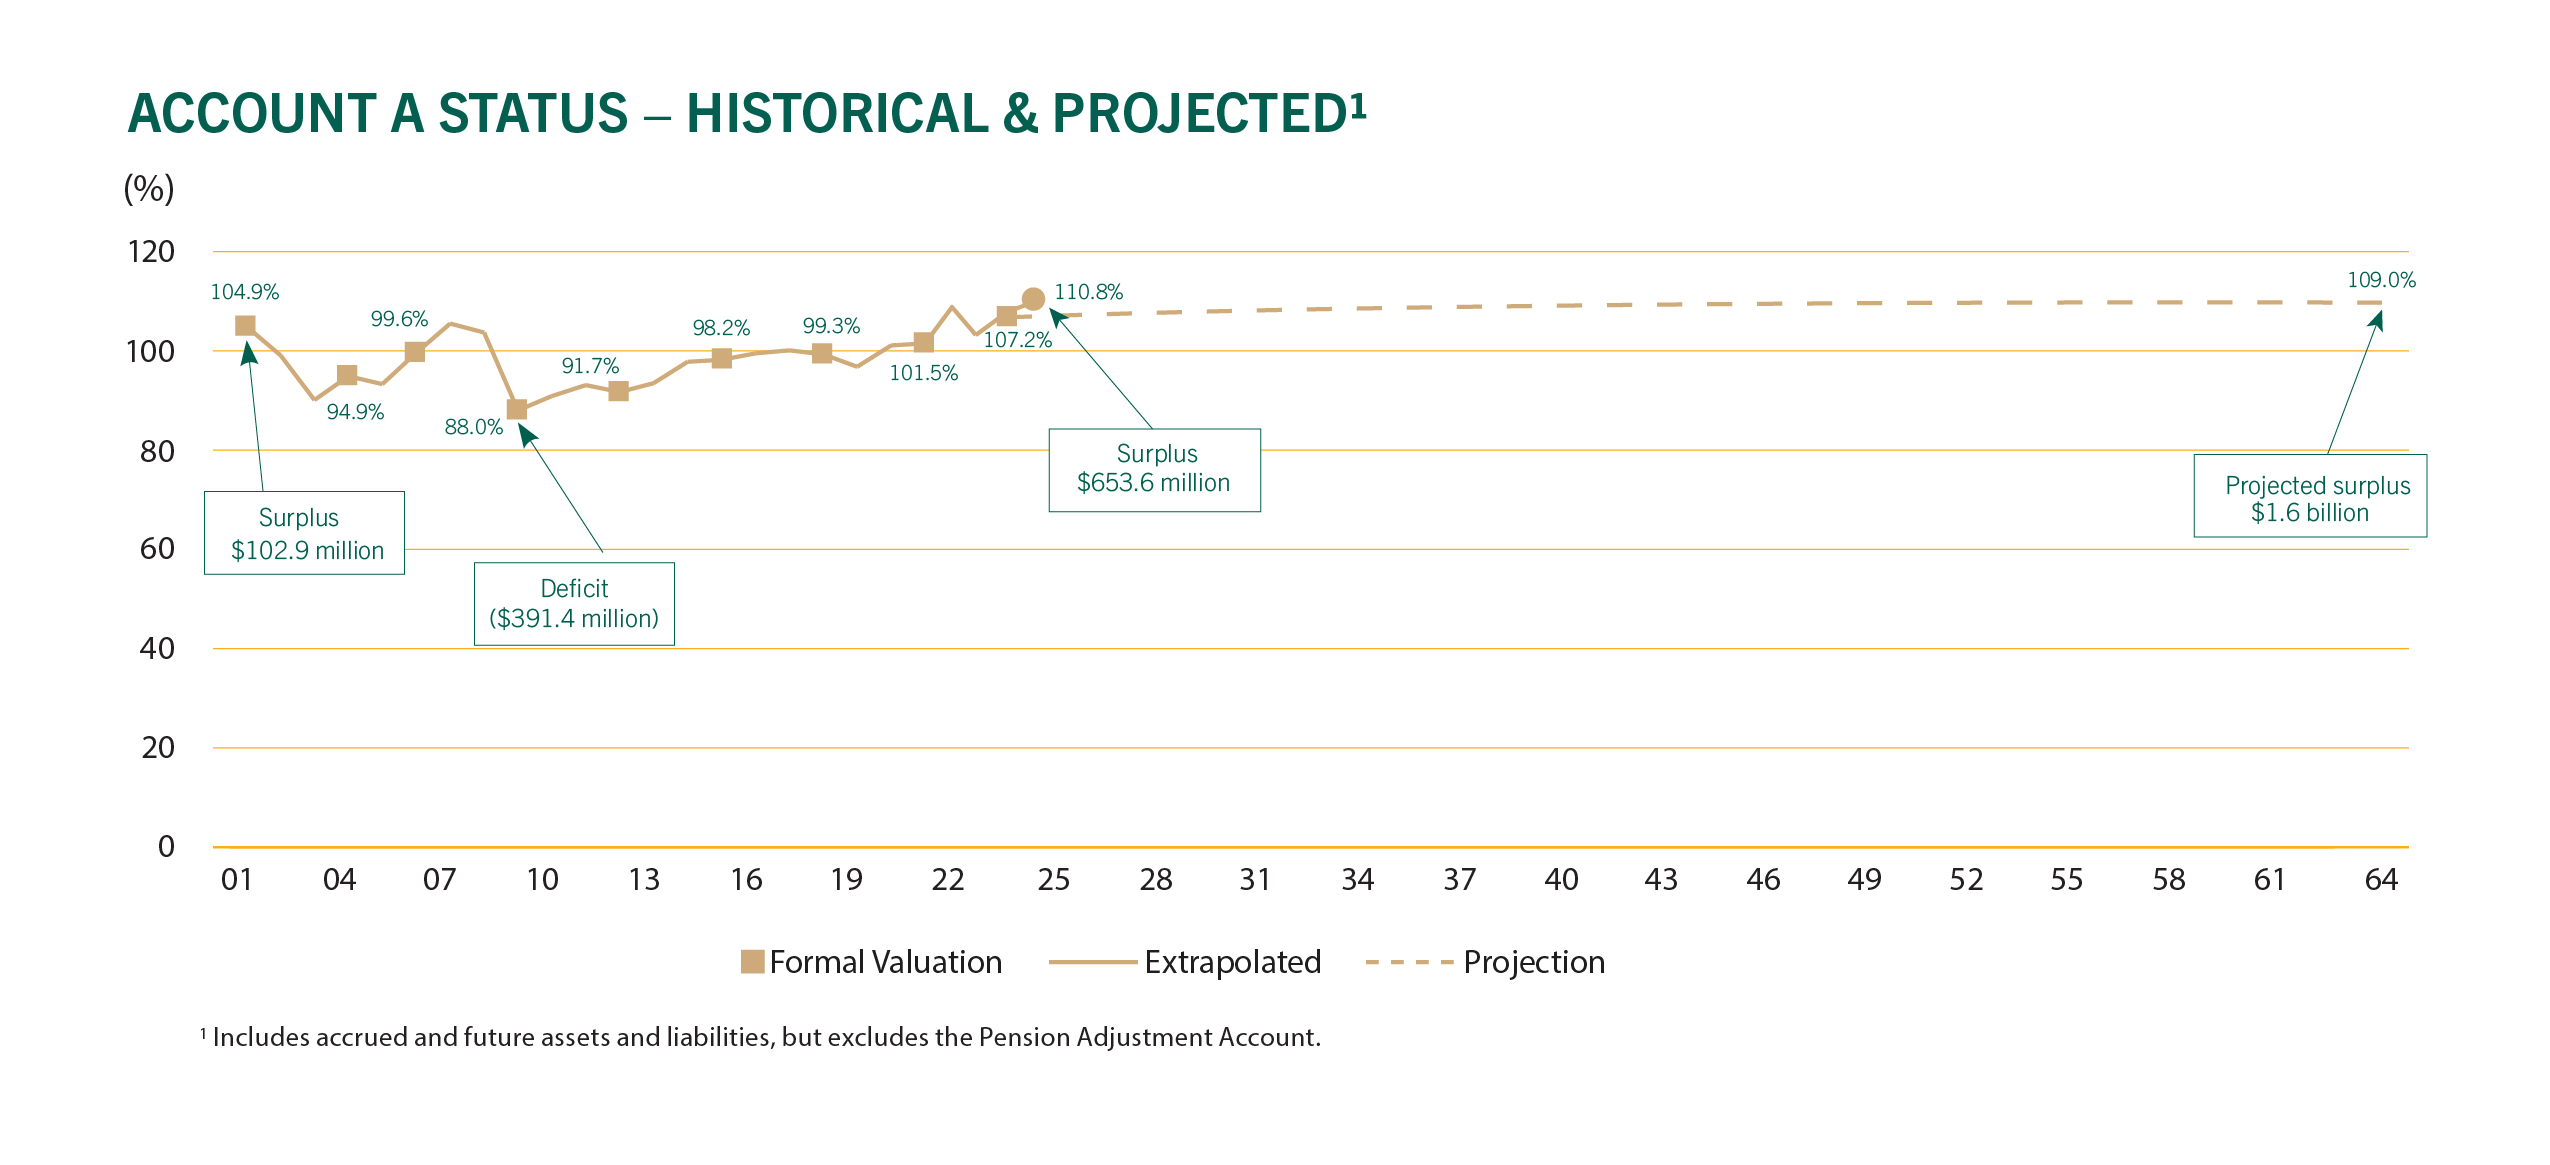
A 40-year projection of the funded status of Account A has been prepared at the same date as the actuarial valuation. The most recent projection of the funded status was prepared as at January 1, 2024. The following chart sets out the historical funded status of Account A since 2001, and the projections to 2064.

As illustrated by the chart, the funded ratio of Account A was 107.2% as at January 1, 2024. This means that, based on the various assumptions adopted, the member account is expected to have assets that are sufficient to fund its 50% share of the pension obligation for all members in the plan as of that date. In dollar terms, the Account A surplus as at January 1, 2024 was $429.9 million.
In addition, Account A’s funded ratio is projected to remain stable over the long term, increasing to 108.1% by January 1, 2044 and 109.0% by January 1, 2064. These projections are based on many assumptions regarding future economic and demographic conditions, which may or may not come to fruition. Similarly, the results of the projection are sensitive to the start date of the projection.
Sensitivity of results
Many assumptions regarding the future economic and demographic experience of the plan are required to project the funded status over the longer term. Therefore, various sensitivity analyses were conducted to determine how the funded status of Account A would change under certain scenarios. This allows the stakeholders to better understand and assess the risks inherent in the plan. Examples of sensitivities prepared include the impact of an increase in life expectancy, changes in retirement patterns, and changes to the valuation discount rate. The impact of a change in future investment returns was also analyzed, as discussed below.
Investment return
The expected long-term rate of return on investment assets is a key assumption in the actuarial valuation. Expected future returns for the total fund are based on the long-term target asset allocation and expected long-term rates of return for each asset class. Expected returns are adjusted for assumed investment management fees, offset by assumed value added for active management and then reduced for a margin for adverse deviations.
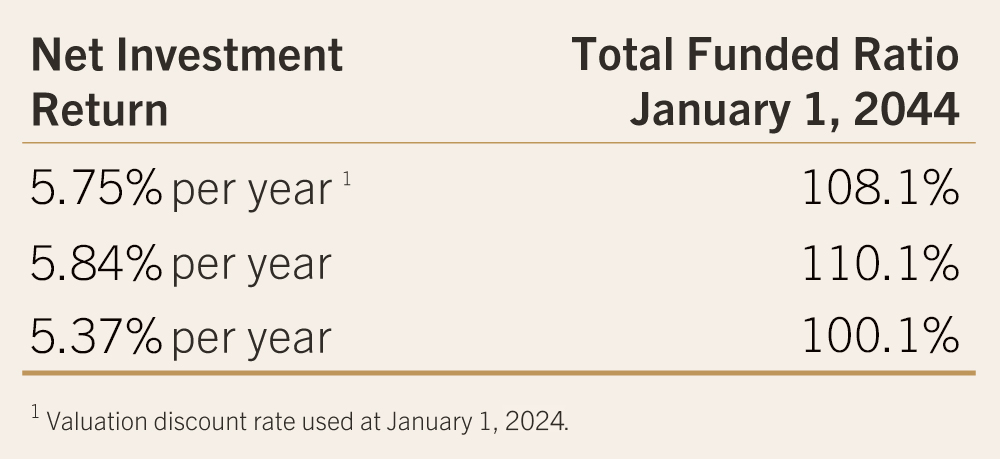
The following table highlights the sensitivity of the total funded ratio for Account A to a change in future net expected investment returns for the period from January 1, 2024 to January 1, 2044.

If the fund earns a return of 5.84% per annum (or 0.09% per annum in excess of 5.75%), the total funded ratio would be able 110.1% after 20 years. Conversely, if the fund earns a return of 5.37% per annum (or 0.38% per annum below 5.75%), the total funded ratio would be about 100.1% after 20 years. As shown, the projected funded ratio is highly sensitive to expected future returns.
Next steps – Account A
In the opinion of the plan actuary, a return of 5.84% per year falls within a realistic range over the long term, so it is reasonable to assume that the current member contribution rate is adequate to provide for Account A’s portion of plan benefits. The plan actuary indicated that no changes to the member contribution rate are required prior to the next actuarial valuation scheduled to be prepared in 2027.
TRAF regularly communicates financial information on the plan to the Province and The Manitoba Teachers’ Society. Consistent with our mission statement, we are committed to ensuring all stakeholders have accurate and timely information on the plan’s funded status so they can make informed decisions regarding contribution rates and benefit levels.
